Flexion
Watch the surfaces change position as the knee bends.

TrueKnee aims to restore your knee’s native anatomy through personalized planning, a defined surgical technique, data-informed care, a structured recovery protocol, and personal Guide support. The five foundations →
TrueKnee Resurfacing · For surgeons
Native anatomy is the reference.
Restoring natural motion is the goal.
What to watch
Follow the medial side: it travels less in this teaching model. Stability does not mean no movement.
Teal: medial · Amber: lateral. Select a cue to show illustrative paths from above.Preparing the motion comparison…
Illustrative 0–120° motion, synchronized by flexion angle. Existing teaching implants; not the proposed implant design or measured postoperative motion. The animation demonstrates a restoration goal, not a predicted result.
Understand the native knee · Faculty presentation
Based on Kinematics of a Native Knee
Michael Hellman, MD · 2024
Motion emerges from the surfaces and the structures between them.
Watch the surfaces change position as the knee bends.
The teaching model pairs greater lateral rollback with rotation. Loading and activity change the pattern.
Surfaces, menisci and ligaments contribute to motion together.
The technique · One knee throughout
Follow the references, preparation, trialing and patellofemoral evaluation.
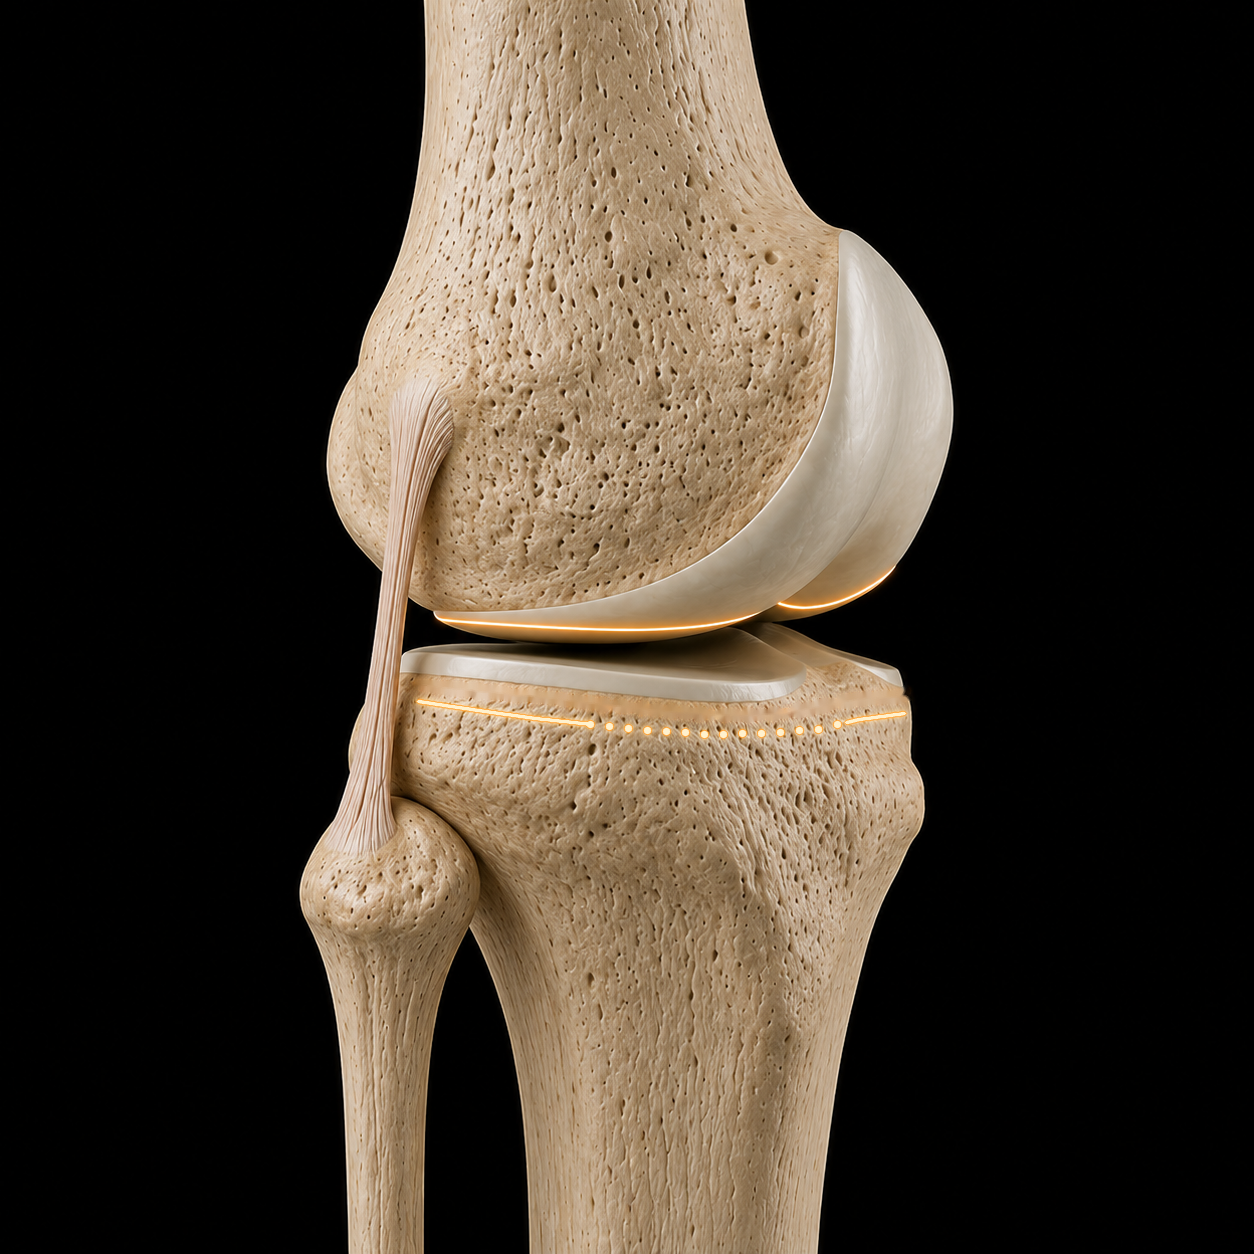
Preparing the reconstruction…
Step 1 / 5
Schematic teaching sequence using the existing anatomy and implant models. Preparation masks and component seating are simplified; the sequence does not depict instrument use or prescribe an operative order. The patella is omitted from this overview and is evaluated in step 5 using the existing patellofemoral animations. Motion is illustrative, not a measured surgical result.
The references behind the technique
Inspect the anatomy that informs each reconstruction step.
ANATOMICAL REFERENCES
Inspect condylar shape, distal joint-line orientation and the medial sagittal slope.
01 · FEMUR
Compare distal height, sagittal curvature and whole-condyle proportions. Similar posterior curvature does not make the complete medial and lateral condyles identical.
Loading femoral anatomy…
Inspect the medial and lateral condyles with intact cartilage.
Illustrative geometry. Surface traces are not fitted circles or axes of rotation. The gold distal line is a surface reference; the dashed shaft line is not a measured mechanical axis.
Elias examined 16 knees radiographically and 10 autopsy knees. The distal condyles, posterior condyles and patellar groove were described with separate circular approximations. These anatomical approximations do not establish one universal radius or validate the traces shown here.
Elias et al. · 1990 · CORR 260:98–103 ↗Matsuda compared 30 normal and 30 varus knees using MRI. The distal medial condyle differed in varus knees, while the posterior medial region did not differ significantly. This supports examining distal and posterior regions separately; it is not evidence that every arthritic knee preserves the same posterior reference.
Matsuda et al. · 1998 · CORR 349:183–188 ↗Meier’s 517-knee MRI series measured condylar lengths and anterior/posterior offsets. Mean posterior offsets were 25.7 mm medially and 23.6 mm laterally. These are distances from the posterior femoral cortex reference, not curvature radii. The cohort included 108 knees with KL 3–4 osteoarthritis; it was not a wholly healthy sample.
Meier et al. · 2023 · Diagnostics 13:350 ↗The existing cartilage-coated model is reused. Its shape variants are authored examples, not subjects from these studies. The femoral head is absent: neither mLDFA nor a clinical mechanical axis is established by the displayed shaft reference.
02 · TIBIA
Inspect the coronal orientation and medial posterior slope. The medial plateau is the sagittal reference used in this technique; compartment differences remain in the anatomy references below.
Outer · lateralInner · medial
BackFront
Loading tibia views…
Illustrative 2D projections. The gold sagittal guide identifies the medial reference. The lateral contour is held fixed and is not a second cutting target. The image does not measure either compartment. Positive sagittal values indicate posterior slope; negative values indicate anterior slope. Coronal zero is perpendicular to the illustrated shaft; positive places the lateral side higher. These are not MPTA readings, patient measurements, or cutting targets.
Hashemi studied subjects without substantial OA or ligament, meniscal or cartilage injury. Across the male and female groups, reported ranges were coronal −1° to 6°, medial −3° to 10°, and lateral 0° to 14°. These set the explorer’s bounds; slider combinations are not study participants. Weak correlations do not establish statistical independence.
The study measured subchondral bone relative to a tibial shaft reference. It described medial concavity and a mostly flat central lateral bearing region within an overall convex lateral geometry. These are not cartilage-surface measurements.
Hashemi et al. · 2008 · JBJS Am 90:2724–2734 ↗Nunley measured the osteoarthritic compartment relative to a plane perpendicular to the sagittal tibial mechanical axis. Mean posterior slope was 6.8° in medial-UKA candidates and 8.0° in lateral-UKA candidates. These are separate groups, not paired medial and lateral measurements in every knee.
Preoperative arthritic anatomy does not establish the pre-arthritic surface. Do not pool these CT values with Hashemi’s MRI ranges or use either as a universal resection target.
Nunley et al. · 2014 · J Arthroplasty 29:1677–1680 ↗Siddiqi compared 965 healthy and 193 osteoarthritic knees using CT. Femoral geometry and compartment-specific tibial slopes differed between groups. This is the study linked from the current patient tibial section; it is not the source of this explorer’s slope ranges and does not validate its animation.
Siddiqi et al. · 2022 · JBJS Am 104:805–812 ↗Measurement axis, plane, tissue boundary and population must be specified when comparing slopes. The restored illustrations demonstrate variation; they do not calculate ligament force, contact pressure or surgical outcomes.
Inspect both articular surfaces, then compare the cruciates, collateral ligaments and menisci through flexion.
Chapter 1 · Native knee
One knee animation. Four studies of native variation.
Loading knee anatomy…
Illustrative paired knees · values drive the teaching pose, not measurements of the artwork. Both sides show the same example.
125 male and 125 female volunteers without orthopaedic or trauma history; both knees were assessed with 19 alignment measurements. Negative HKA denotes varus. These percentages describe knees, not people.
Varus: HKA ≤−3° · Neutral: −3° < HKA < +3° · Valgus: HKA ≥+3°. Mean HKA: −1.87° in male knees and −0.79° in female knees.
Both distal femoral and proximal tibial geometry differed across alignment groups. MPTA had the strongest reported association with constitutional varus (R² = 0.408); mLDFA also contributed (R² = 0.294). These statistics are not additive shares of causation.
| Measurement | Varus | Neutral | Valgus |
|---|---|---|---|
| mLDFA · femur | 89.03 ± 1.46 | 87.61 ± 1.60 | 85.49 ± 1.92 |
| MPTA · tibia | 85.13 ± 1.81 | 87.60 ± 1.74 | 89.06 ± 1.42 |
| JLCA · joint-line convergence | −0.44 ± 1.11 | −0.53 ± 1.04 | −0.64 ± 0.85 |
Activity in the second decade of life was associated with greater varus. The highest-activity group differed from school-only activity (p < 0.01) and 1–3 hours/week (p < 0.05). Retrospective activity reporting and a cross-sectional design do not establish cause.
Native alignment is variable, and forcing every knee toward the same geometric pattern may change its anatomy. This study did not compare postoperative targets, implant survival or clinical outcomes. Young volunteers do not represent all arthritic knees. Radiographic positioning and a single reader are measurement limitations.
Source: Bellemans, Colyn, Vandenneucker & Victor. CORR 2012;470:45–53. DOI 10.1007/s11999-011-1936-5. Prevalence and bone angles above follow the paper’s tables. Table 1 and the results prose swap the male/female HKA standard deviations; only the consistent sex-specific means are shown here.
Illustrative anatomy and example angles, not patient measurements or surgical targets. Playback is a teaching sequence, not a population distribution.
The patient-side knee artwork is reused throughout. The animation shows alignment and joint-line tilt; it is not a full-limb radiographic measurement or a biomechanical simulation. Each study keeps its own cohort and definitions. The healthy Belgian cohort in the original CPAK study draws on the constitutional-varus work; these are not independent population samples.
LDFA: lateral distal femoral angle. MPTA: medial proximal tibial angle. Original CPAK estimates constitutional alignment with their difference and describes joint-line obliquity with their sum. Functional phenotyping and modified CPAK use different group definitions. No automatic conversion between their category labels is implied.
These anatomy and classification findings do not establish a superior postoperative target or long-term clinical outcome.
Pinskerova & Vavrik’s 2020 chapter revisits the MRI and anatomical studies. Compare its original diagrams with the animation.
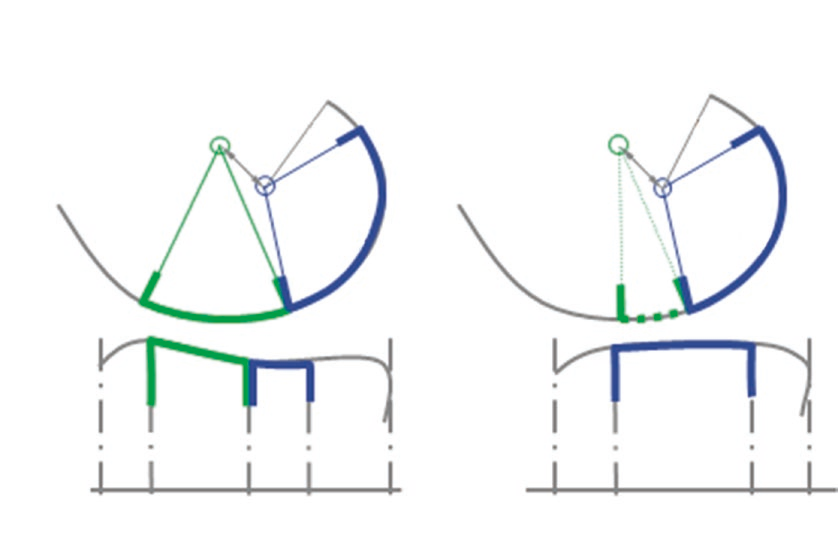
The center of the posterior circular facet sits inside the femoral condyle. The articular surface stays above the tibial surface.
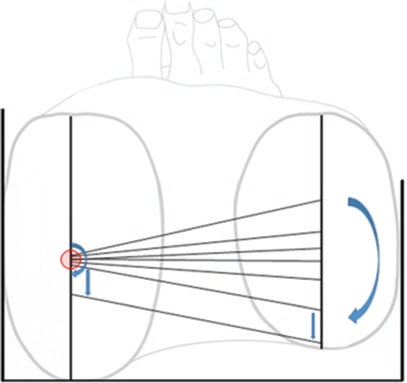
The medial ends cluster together while the lateral ends sweep posteriorly. Our animated replay is limited to 0–120°.
Unloaded teaching reference · 0–120°
Knee motion varies with loading and activity.
This authored illustration emphasizes medial stability and lateral rollback, informed by unloaded cadaver studies. Its motion and counters are prescribed teaching values, not measured living-knee or implant kinematics.
Iwaki, Pinskerova and Freeman mapped this pattern in unloaded cadaver MRI. Living-knee MRI studies by Hill and Johal show that loading can alter both the magnitude and timing of motion. Fluoroscopy studies, including Komistek, also show that individual knees and activities vary.
ANATOMIC RESURFACING UNLOADED TEACHING REFERENCE
Preparing the 3D knee…
Living-knee MRI · 0–120°
Same knee model. Different loading conditions.
In this small MRI study, lateral rollback occurred earlier during a weight-bearing squat. Switch conditions at the same flexion angle to compare.
Follow the teal medial and amber lateral dots. Their trails show where the model’s estimated contact locations have travelled; use Axial view to compare both compartments.
Pinskerova et al. (2004), Table I · Five volunteers, both conditions. Published mean condylar-center positions drive this illustration; motion between samples is interpolated.
A study-specific squat example—not a walking pattern, a universal normal knee, or an implant-performance comparison.
Walking, squatting and lunging measure different parts of knee function. These studies add context; their trajectories are not blended into the animation.
In 20 male volunteers, dynamic fluoroscopy showed earlier femoral external rotation during a squat than during seated non-weight-bearing flexion.
Bone landmarks and lowest surface points were tracked; ligament forces were simulated.
Kono et al., 2025 · 2026 figure-order correctionIn eight healthy knees, the location of peak cartilage contact deformation travelled farther front-to-back medially than laterally during treadmill stance.
MRI and dual fluoroscopy measured cartilage contact deformation, not condylar-center travel.
Liu et al., 2010Eight knees in seven healthy participants showed distinct phases of rotation during a weight-bearing lunge. Contact-point movement also changed in deep flexion.
MRI and dual fluoroscopy at held positions; a lunge is a different task from walking or a bilateral squat.
Qi et al., 2013In nine healthy men, MRI under 400 N axial load showed larger cartilage-to-cartilage contact areas in both compartments, with different meniscal contact responses.
Static loading in an MRI scanner, not dynamic gait. The animation does not model menisci, deformation or pressure.
Mayr et al., 2026The MRI table reports positions at 0°, 20°, 45°, 90° and 120°. At 45°, lateral posterior travel is 13 mm loaded versus 2 mm unloaded. Medial travel is 1 mm anterior in both conditions. At 120°, lateral travel is 20 versus 14 mm, respectively.
The original surface model, cameras and seating method are reused. AP motion follows the table; axial rotation is derived to fit this model’s reference-center spacing. Coronal seating and vertical clearance are geometric corrections, not measured weight-bearing responses. The animation does not calculate muscle forces, ligament tension, cartilage pressure or ground reaction forces. Playback timing is illustrative. The colored dots and trails are smoothed surface-proximity estimates calculated separately for each condition from this model. They are not the MRI study’s measured contact points or contact areas, and should not be interpreted as pressure maps.
Johal et al. (2005) also observed earlier and greater rotation under load. Hill et al. (2000) reported approximately 4 mm medial forward movement in a separate loaded cohort. These observations are not averaged into this trajectory.
A 2018 in-vivo fluoroscopy study found activity-dependent patterns, including bicondylar rollback during later squat flexion. Different measurements and cohorts need separate interpretation. This native-knee illustration does not establish the design rationale or performance of Persona, medial-pivot or other implants.
Unloaded teaching reference · 0–120°
Both sides move.
Watch the lateral side travel farther back.
Follow the blue arrows: the medial center stays close to its starting point while the lateral center travels backward.
Preparing the close-up views…
Illustrative pattern · medial movement begins gradually around 35° here; timing varies between knees and activities.
Both blue travel tracks use the same scale. The open pink ring marks the contact estimate at 35°; the solid dot marks its current position.
This prescribed teaching example keeps the medial posterior reference center nearly fixed in the anteroposterior direction through 35°, then gradually introduces 3 model units of posterior movement by 120°. Coupled rotation gives the lateral center substantially greater travel. These values and the 35° onset were chosen for the illustration; they are not universal thresholds or measurements from a published cohort.
Published findings vary with loading, activity, rotation and measurement method. Freeman and Pinskerova emphasize medial stability through the main flexion arc; Johal reported minimal medial posterior translation until approximately 120°, while Hill observed some anterior medial movement during loaded squatting. This animation demonstrates relative stability and possible modest motion, not a single path followed by every native knee.
Blue dots track the actual transformed posterior condylar reference centers. Dashed lines stay fixed at their full-extension AP positions. Pink markers and their trails are geometric surface-proximity estimates sampled from the seated model, not measured cartilage contact or pressure. The open pink ring stays at the 35° estimate, separating early contact transfer from subsequent travel; the trail is identical when scrubbing or playing backward. Blue arrows show center displacement from the fixed extension line. Both projections face the same direction at the same scale. The original anatomy and seating guard are retained; this is not a validated biomechanical simulation.
Freeman & Pinskerova · 2003 ↗ · Johal et al. · 2005 ↗ · Hill et al. · 2000 ↗
Loading, rotational position and the depth of the bend change the movement. These study diagrams separate those effects from the illustrative 3D knee.
Start together, then watch the lateral centres separate.
Pinskerova et al. (2004), Table I · The same five volunteers in both conditions. Dots show each flexion-facet centre’s travel relative to extension, with starting positions aligned for comparison. The outlines and connecting lines are schematic, not measured femoral orientation. Movement between measured positions is interpolated.
Hill et al. (2000) examined 13 unloaded living knees and seven loaded knees. The loaded group showed about 4 mm of medial forward movement. In four knees tested with altered rotational positioning, tibial external rotation suppressed the usual accompanying internal rotation during squatting to 90°. This is a separate cohort from the five-volunteer comparison above; the datasets are not interchangeable.
Iwaki et al. (2000) studied six unloaded cadaver knees. Their pattern included early axial rotation, comparatively little additional rotation to approximately 45°, and greater rotation later. The 3D patient animation uses an illustrative phased trajectory based on this description, not digitised individual-knee data.
Contact location is not condylar translation. Pinskerova et al. measured contact as the closest approach of the subchondral plates on MRI. This is not a pressure map or the full cartilage–meniscus load-bearing area. These related studies and the later review do not establish one universal trajectory, ligament-force behaviour, or clinical outcomes after resurfacing.
The live values are prescribed animation targets, not measurements from this specimen. Medial AP is the flexion-facet-center translation, not the migrating contact point. The animation uses 1 mm medial and 20 mm lateral posterior translation with 19.9° coupled rotation at 120°. The sagittal overlays identify the flexion-facet centers; they do not represent contact patches. The bone positions include a geometric surface-clearance correction, not a force-based cartilage simulation.
The medial-pivot pattern is a teaching reference, not an invariant rule or evidence favoring a particular implant design. Hill reported approximately 4 mm medial forward movement in loaded knees. Komistek studied five knees and reported individual variation, including a lateral-pivot subject. These studies do not establish that every native knee has no medial rollback or that loading affects timing alone.
Bone geometry: Open Knee(s), specimen oks009, mirrored to a right-knee teaching reference. Articular surfaces and ghosted menisci are illustrative. Geometry, animation license and adaptation details. This is not a patient-specific or validated joint-contact simulation.
Komistek · Living, weight-bearing knees
The lateral side moves more on average. Deep flexion shows more translation and rotation than walking.
Current model motion · from extension
Study averages · medial 0.9 mm · lateral 4.3 mm · axial rotation < 5°
Current model motion · from extension
Study averages · medial 2.9 mm · lateral 12.7 mm · axial rotation > 13°
The native-knee model illustrates the reported AP averages. Walking uses an authored 0–60° arc; deep bending uses 0–120°. These arcs and intermediate motion are not recorded study trajectories. The live readouts follow the rendered model: AP is condylar-center travel from extension, positive posterior; rotation is model-derived tibial internal rotation relative to the femur. Study averages are listed separately. Model rotation is not fitted to the study’s rotation values. The fibula identifies the lateral side. Teal and amber dots are surface-proximity estimates, not measured contact or pressure.
Komistek, Dennis & Mahfouz (2003) ↗ · Five normal knees · CT models + fluoroscopy · Five weight-bearing activities
Review faculty cases, clinical outcomes and the complete teaching collection.
Continue your surgical education